
Journey to the Poles of Inaccessibility
The project brief:
We were approached by Chris Brown, an individual on a one man mission to travel to 20 identified Poles of Inaccessibility around the world. As leading providers of spatial data solutions and GIS software to the UK market for 25 years, our team were confident that they could meet the customers’ bespoke requirements.
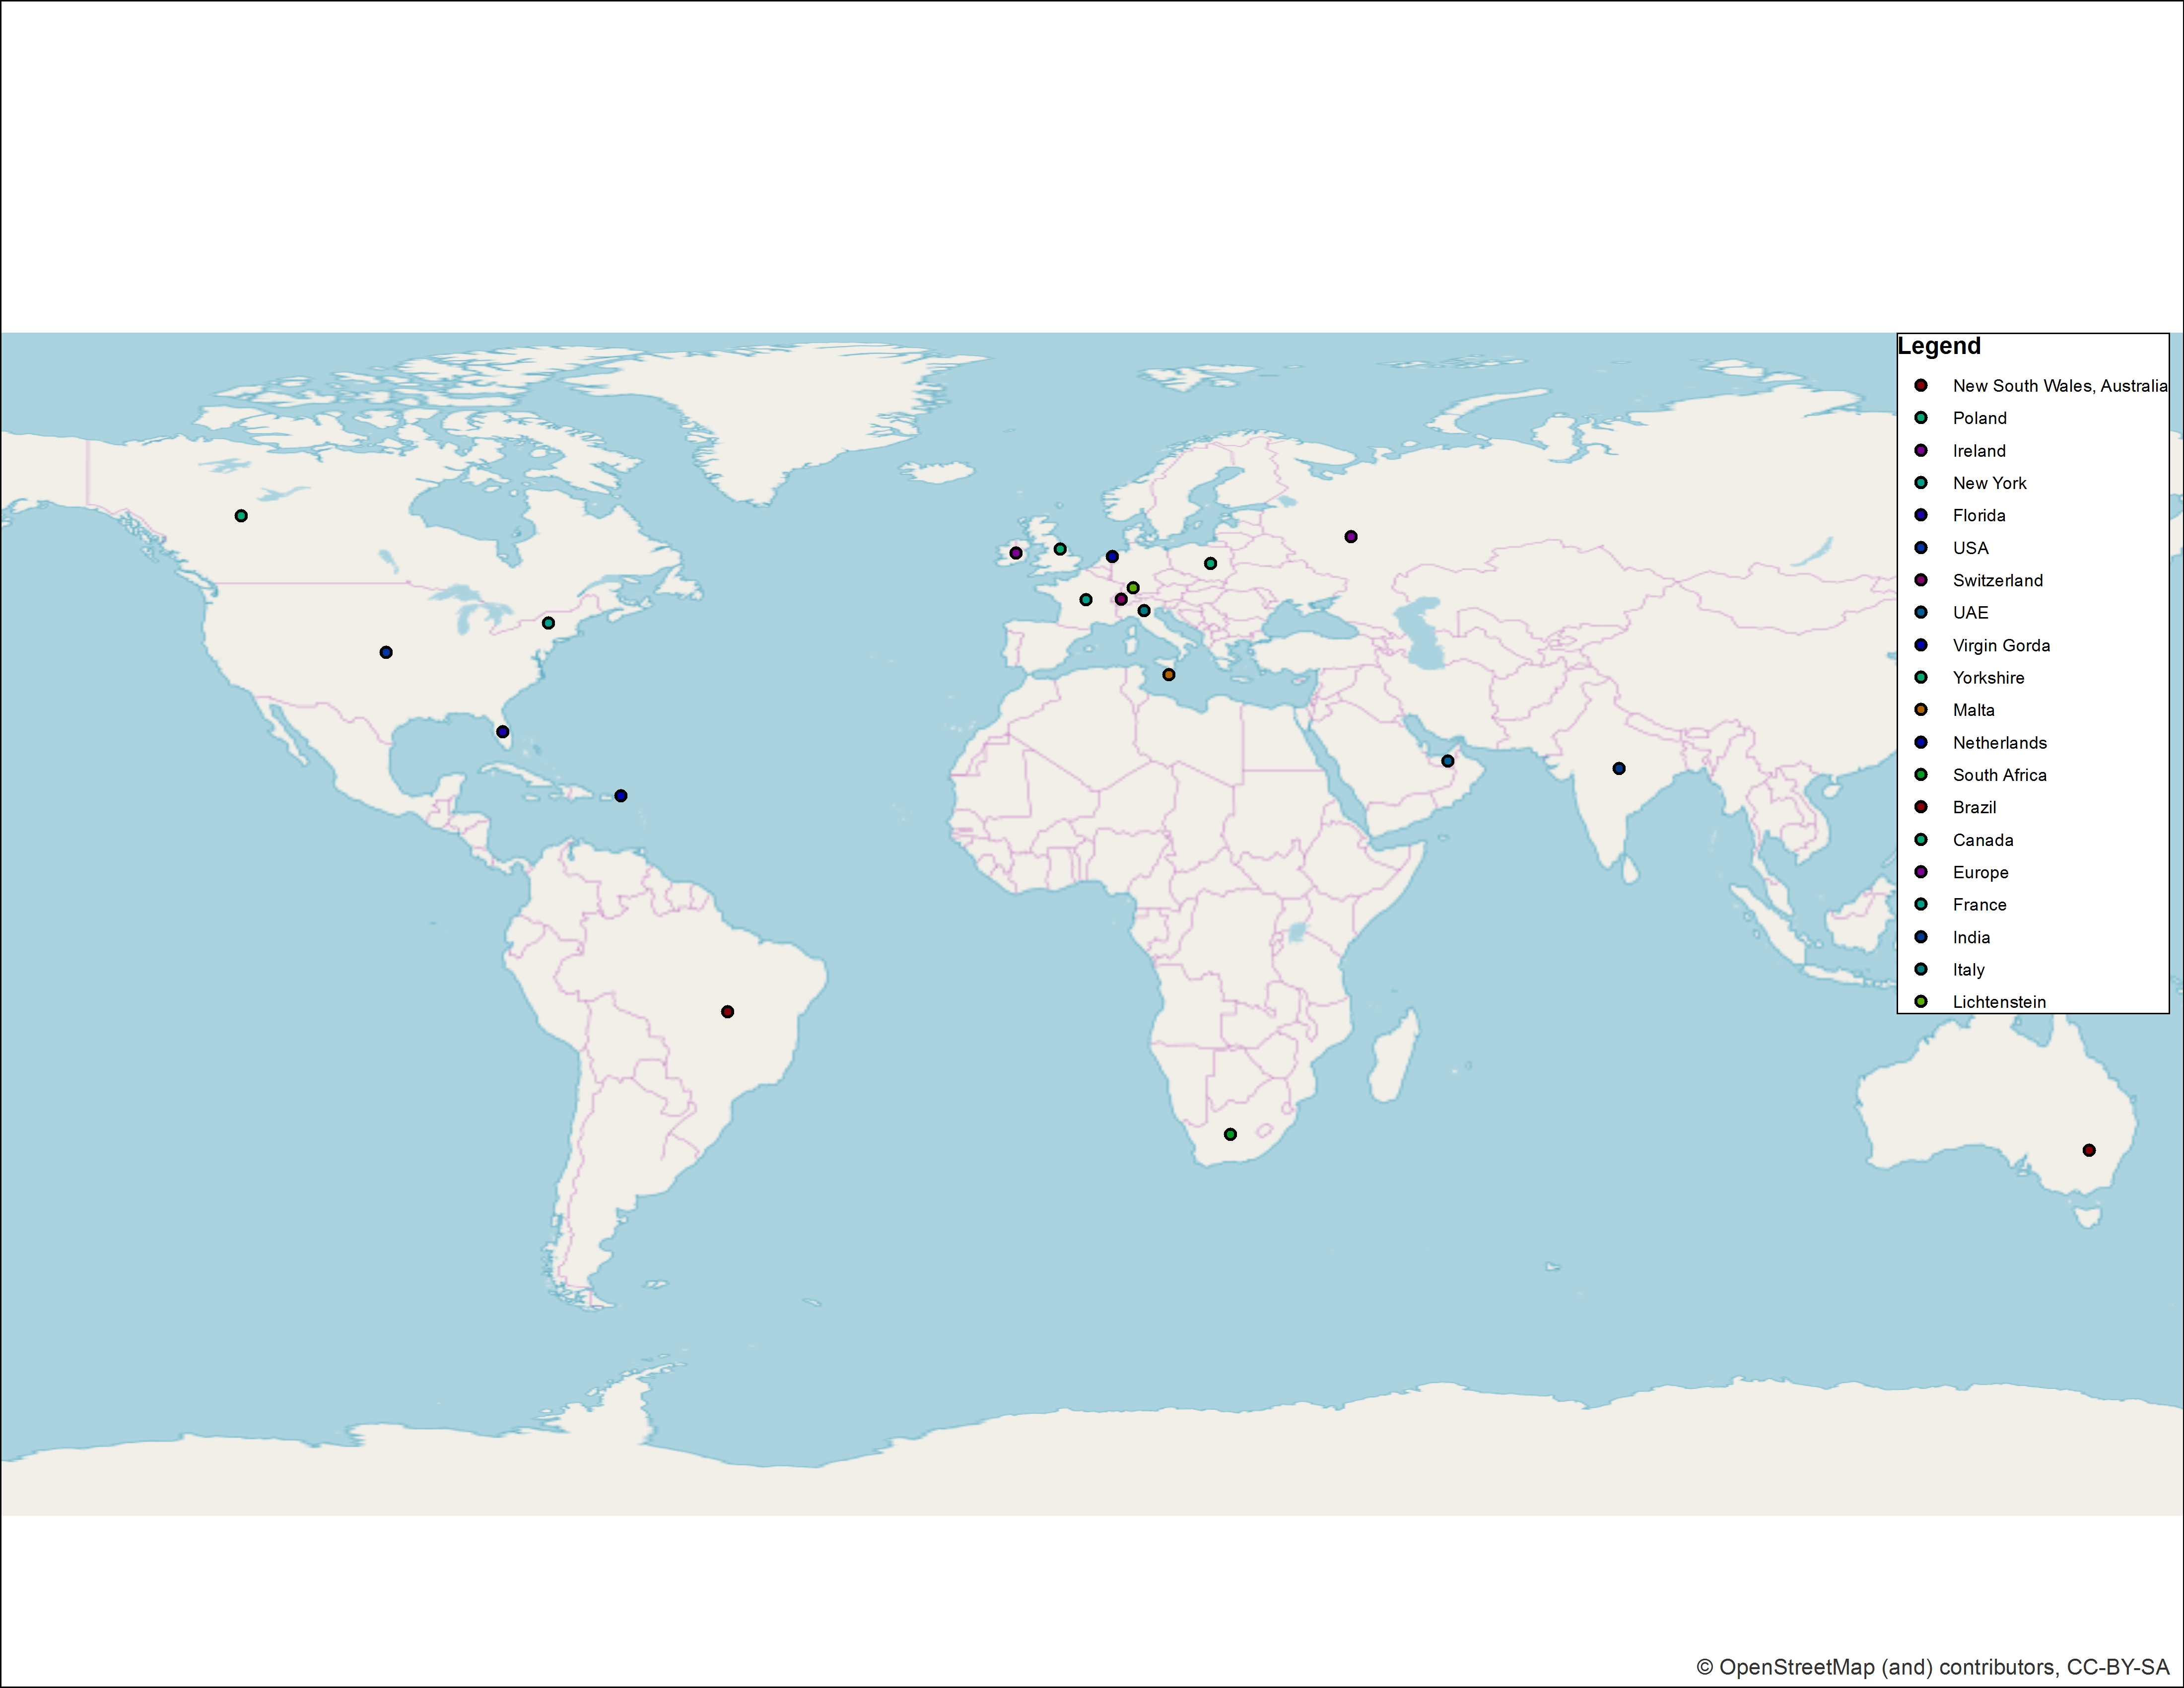
Chris had identified 20 locations in which he would like to travel to a ‘Pole’. It was up to Miso to calculate where these poles were and place them as points on a map, also providing co-ordinates so that the customer could have confidence that the exact location being navigated to truly qualified as a Pole of Inaccessibility.
The team would have to be flexible, and adapt to any alterations made to the exact details of the project as it was being completed.
What are Poles of Inaccessibility?
Poles of Inaccessibility, in basic terms, are points on the map that are the furthest from a boundary. The initialism POI is often used to refer to the Poles, but Chris also puts forward an alternative; PIA (as in Points of InAccessibility). A POI/PIA is located at the most distant point from the boundaries within a given area. This means that a PIA is not necessarily the geographical centre of the same area (Centre of Gravity). The Poles of Inaccessibility theory can therefore be applied to any area as all areas, no matter how small, have boundaries. It’s been suggested that points located on smaller land masses should be labelled instead as Points of Inaccessibility.*
The solution:
The team combined their extensive knowledge and experience with spatial data and GIS to provide the customer with the data he needed to navigate to the POIs provided, with accuracy and confidence. To provide this, in brief, the team did the following:
- Using ESRI ArcMap, the boundaries of the requested areas were identified and clipped individually. The area was now a polygon in SHP format.
- Next, using QGIS and its helpful plugin, ‘Pole of Inaccessibility’, the calculation was made and the point placed within the polygon.
- A Google Roads basemap was imported into QGIS and used as a backdrop to show the geographical location of the point, before the result was exported as a SHP file.
- Using FME, two Workflows were built for separate purposes:
- The first generated a latitude and longitude co-ordinate for the point.
- The second calculated the distance from the point to its nearest boundary.
- The process was repeated for each of the 20 points supplied to the customer.
- The points were combined on a single map view, with details of each point included in an accompanying .csv file.
The result:
Once the team had checked the outputs, both the .tiff format map image, and the accompanying .csv file were delivered to Chris. The .csv file contained details including: location of point, longitude and latitude, and the distance (in metres) from point to nearest boundary.
Chris has already began visiting the locations that we provided him with. He’s even been kind enough to share some photos of his travels with the team here at Miso.
Chris has also set-up his own blog, charting his travels to each Pole of Inaccessibility – you can follow his progress here.
All the best for the remaining visits, Chris!
* There is some deliberation over the use of the term “Poles of Inaccessibility”, and whether this should be re-termed in the context of this project, as “Points of Inaccessibility”. The original Poles were calculated in 2007 by Garcia-Castellanos & Lombardo, and the term coined then. For points located on smaller land masses, would the term “Points of Inaccessibility” be more fitting? Chris has his own views on the terminology, which is available to read here.